Why SAG Mills Underperform: Five Levers That Actually Move Throughput
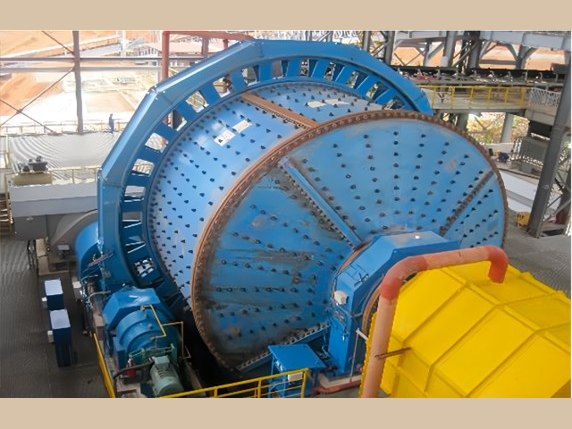
In almost every large concentrator, the SAG mill is where the money is: it carries the highest capital and operating cost in the flowsheet, it is usually the production bottleneck, and it is the asset most likely to stop the plant. So the first engineering question is not 'how do we push it harder' but 'what should this mill achieve'. Modern comminution theory answers that question. Bond-Rowland, Bond-Barratt, Morrell and SPI/SAGDesign models predict the specific energy (kWh/t) needed to take an ore from a given F80 to a target P80, based on laboratory indices — Bond work indices (Wic, Wib, Wir), SMC results (DWi, Mia, Mib, Mih), SPI and SAGDesign parameters. There is a catch: those predictions only hold for a circuit that is already well optimised. In plant audits we routinely find circuits sitting 15–25% above their theoretical energy — which is exactly where the cheapest tonnes live.
Everything starts with honest ore characterisation. The JK drop weight test produces the A*b impact-breakage parameter and the tn family of appearance functions; the SMC test delivers DWi and the Mia/Mib/Mih indices from a small drill-core sample. This matters because ore hardness dominates SAG economics: across the worldwide distribution of A*b values, an ore body drifting from 'soft' to 'hard' can double the specific energy demand of the very same mill. If the tested samples do not represent the mine plan — oxides vs sulphides, year one vs year ten — no amount of downstream modelling will rescue the design. Representative sampling is not a laboratory detail; it is the foundation of the business case.
Lever one: power draw. A well-run SAG mill should draw about 90% of its installed power, and a ball mill about 95%. If your mill sits below that, the limit is structural or operational — mill load, speed, ball charge, total filling — and a competent mill model will tell you how much more power the charge can actually absorb before the honest answer becomes 'none'. The goal is to balance the stages so the whole SABC circuit, not just one machine, draws maximum useful power.
Lever two: feed size. SAG throughput and transfer size are extremely sensitive to both F80 and the fines content of the feed. The toolkit is familiar — blast optimisation, a secondary crushing stage, or HPGR ahead of the mill. Cadia's SABC circuit is the classic example: with HPGR supplying most of the SAG feed at an F80 of just 17 mm, far finer than conventional run-of-mine feed, the mill became a different machine — and needed different liners, which brings us to lever four. Before touching feed size, answer three questions honestly: is the SAG mill really the bottleneck, does the ball mill have spare power, and what will a finer SAG product do to final grind size and flotation recovery?
Lever three: transfer size, pebble management and classification. Adjusting grate and pebble-port apertures, trommel cut size and pebble-crusher settings shifts work between the SAG and ball stages. At Telfer, closing the pebble-crusher gap by 1 mm lifted total circuit throughput by 2–3% — and the winning control variable was pebble-crusher specific energy, not motor current. Northparkes moved deliberately the other way: ball size 125→105 mm, total charge 13→18%, grate apertures 60→40 mm, discharge screen 7→5.5 mm — trading about 2% of throughput for a flotation feed 22 µm finer. One warning from hard experience: chasing very high circulating loads invites slurry pooling, falling power draw and ball scats escaping the mill — apparent gains that evaporate in operating cost.
Lever four: grinding media and liners. Ball-size optimisation in SAG mills is still too often done by folklore; the correct route is a plant survey, drop weight data, and simulation to find the size that matches your ore's breakage rates. The wrong ball size costs grinding efficiency, accelerates liner breakage, and generates scats that chew through pumps, pipes, screens and cyclones. Liners deserve the same rigour: face angle, lifter height, spacing and width define the trajectory of the outermost ball layer — where the charge toe and shoulder sit — and new versus worn liners want different operating speeds. At Cadia, liners were redesigned for the fine HPGR-based feed: fewer rows, a low-low profile, flatter lifter angles, rubber pulp lifters in places. Throughput rose from 2,455 to 3,000 t/h. And never forget the pulp lifters: if their volumetric capacity falls short, the mill pools, power drops and throughput follows it down.
The fifth lever is not a lever at all — it is method. At Mt Copper, a year of adjusting speed, grates, ball size and screens achieved nothing until drop weight tests finally revealed ore with A*b below 24. JKSimMet simulation plus mobile crushing-plant trials justified adding pre-crushing; the result was throughput up from 1,288 to 1,652 t/h, SAG ball consumption down from 600 to 375 g/t, SAG specific energy down from 9.3 to 7.9 kWh/t, and metal recovery up from 80% to 83%. Batu Hijau tells the same story at larger scale: despite ore hardening year on year, the plant exceeded its 120,000 t/d design through expanded pebble crushing (SABC-B), continuous hardness testing, liner, grate and pulp-lifter changes tracking the ore, and ball-charge and cyclone optimisation.
The common thread in every one of these cases: characterise the ore, model the circuit, then touch the hardware — in that order. Practically, that means regular energy-efficiency audits, disciplined plant surveys, representative sampling designed into the plant rather than improvised, and proven models such as JKSimMet and Morrell. This is exactly the work Yanvic Minerals does every week: JK drop weight and SMC testwork, comminution modelling, mill sizing and liner design — and, when the answer is new hardware, mills and components fabricated under strict ITP inspection. If your SAG mill draws 70% of installed power while the ball mill screams at its limit, send us your operating data: the gap between your mill and its theoretical energy is usually worth a conversation.
Have a parcel to sell, or a plant problem to solve? Talk to our team.
Get a Quote